RLATE
Relational Language Assessment
Thank you for your interest in the Relational Language Assessment and Training Elements (RLATE)! The RLATE includes the Relational Language Assessment (RLA) and the Relational Language Training curriculum (RLT).
The following is a proposed training sequence for the RLATE. Hours may vary depending on the amount of practice and feedback you would like during training. The course is yours to curate according to the needs of your practice!
Please don’t hesitate to contact us if you have any questions or if you would like to discuss further.
Duration
6–10 hours (2 hours/session)
BACB CEUS available
Description
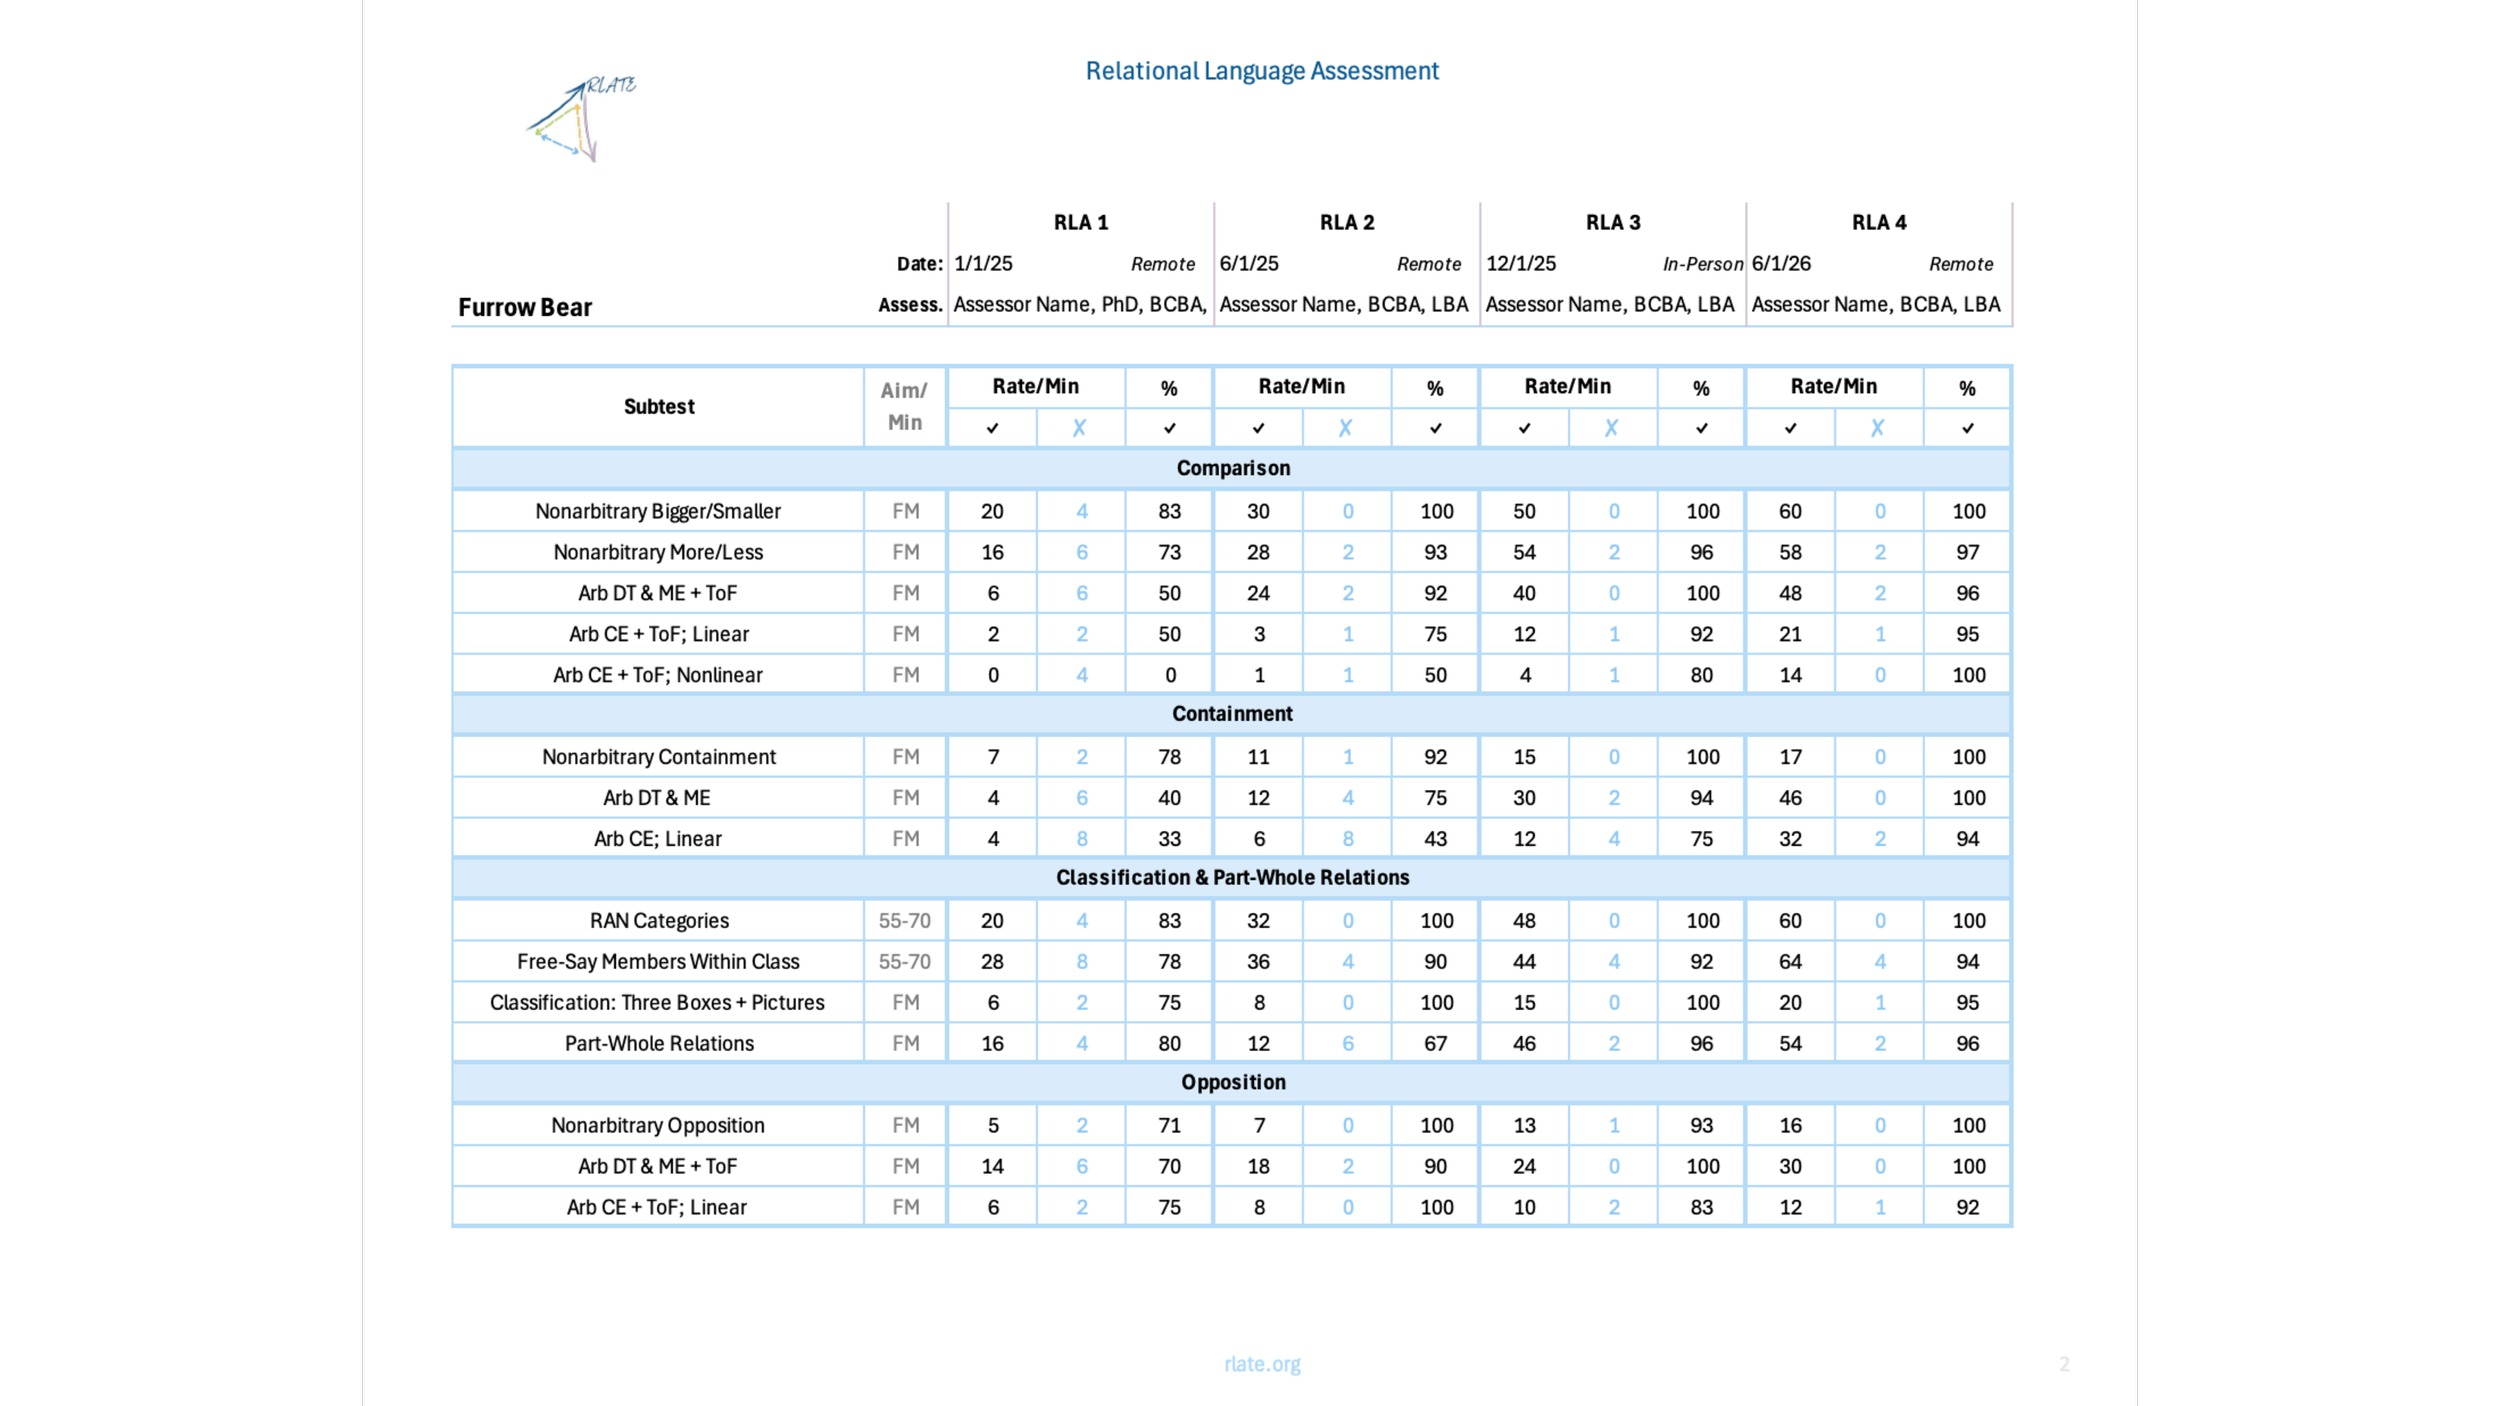
The Relational Language Assessment (RLA) is a research-based instrument designed to evaluate relational framing across a range of relational frames, including coordination, distinction, comparison, opposition, spatiality, temporality, containment, hierarchy (including classification), deictics, and analogy. The RLA also assesses relational derivation, flexibility, coherence, and complexity within and across larger relational networks, as reflected in the Relate Relational Networks and Comprehension subtests.
The RLA measures progressively increasing levels of relational responding, ranging from nonarbitrary to arbitrary relations, including mutual entailment, combinatorial entailment, and the transformation of stimulus functions within and across frames. This functionally specified approach to relational language supports the development of generative language, as well as greater flexibility, complexity, and coherence in relational responding.
The Relational Language Assessment (RLA) includes 15 testing domains:
Rapid Automatic Naming
Color Names
Shape Names
Picture Names
Bidirectional Responding
Bidirectional Responding (stimulus equivalence)
Nonarbitrary Features
Physical Features: Shapes
Physical Features: Common Items
Non-Deictic Spatial Relations
Coordination & Distinction
Nonarbitrary Same vs. Different
Arbitrary DT & ME + ToF
Arbitrary CE + ToF; Linear & Nonlinear
Arbitrary CE + ToF; Linear & Nonlinear + Unknown Relations
Compare Relational Networks
Compare Shapes
Compare Common Items
Comparison
Nonarbitrary Bigger/Smaller
Nonarbitrary More/Less
Arbitrary DT & ME + ToF
Arbitrary CE + ToF; Linear
Arbitrary CE + ToF; Nonlinear + Unknown Relations
Containment
Nonarbitrary Containment
Arbitrary DT & ME
Arbitrary CE; Linear
Classification & Part-Whole Relations
RAN Categories
Free-Say Members Within Class
Classification: Three Boxes + Pictures
Part-Whole Relations
Opposition
Nonarbitrary Opposition
Arbitrary DT & ME + ToF
ArbitraryCE + ToF; Linear
Temporality
Nonarbitrary Temporality
Arb DT & ME +ToF
Arb CE + ToF; Linear
Do X Before/After Y
Socio-Verbal Temporal Relations
Comprehension
Sequencing: Do it Backwards
Conditional/Causal: What Caused it? + Pictures
Conditional/Causal Relations
Derived InformationQuestions
Listening Comprehension: Short Story Retell
Functions
Fluent Functions
Functions Across Contexts
Different ways to…
Relate Relational Networks
Compare Function, Feature, Class
Flexible Relations with Two Items
ToF + Pictures
ToF w/o Pictures
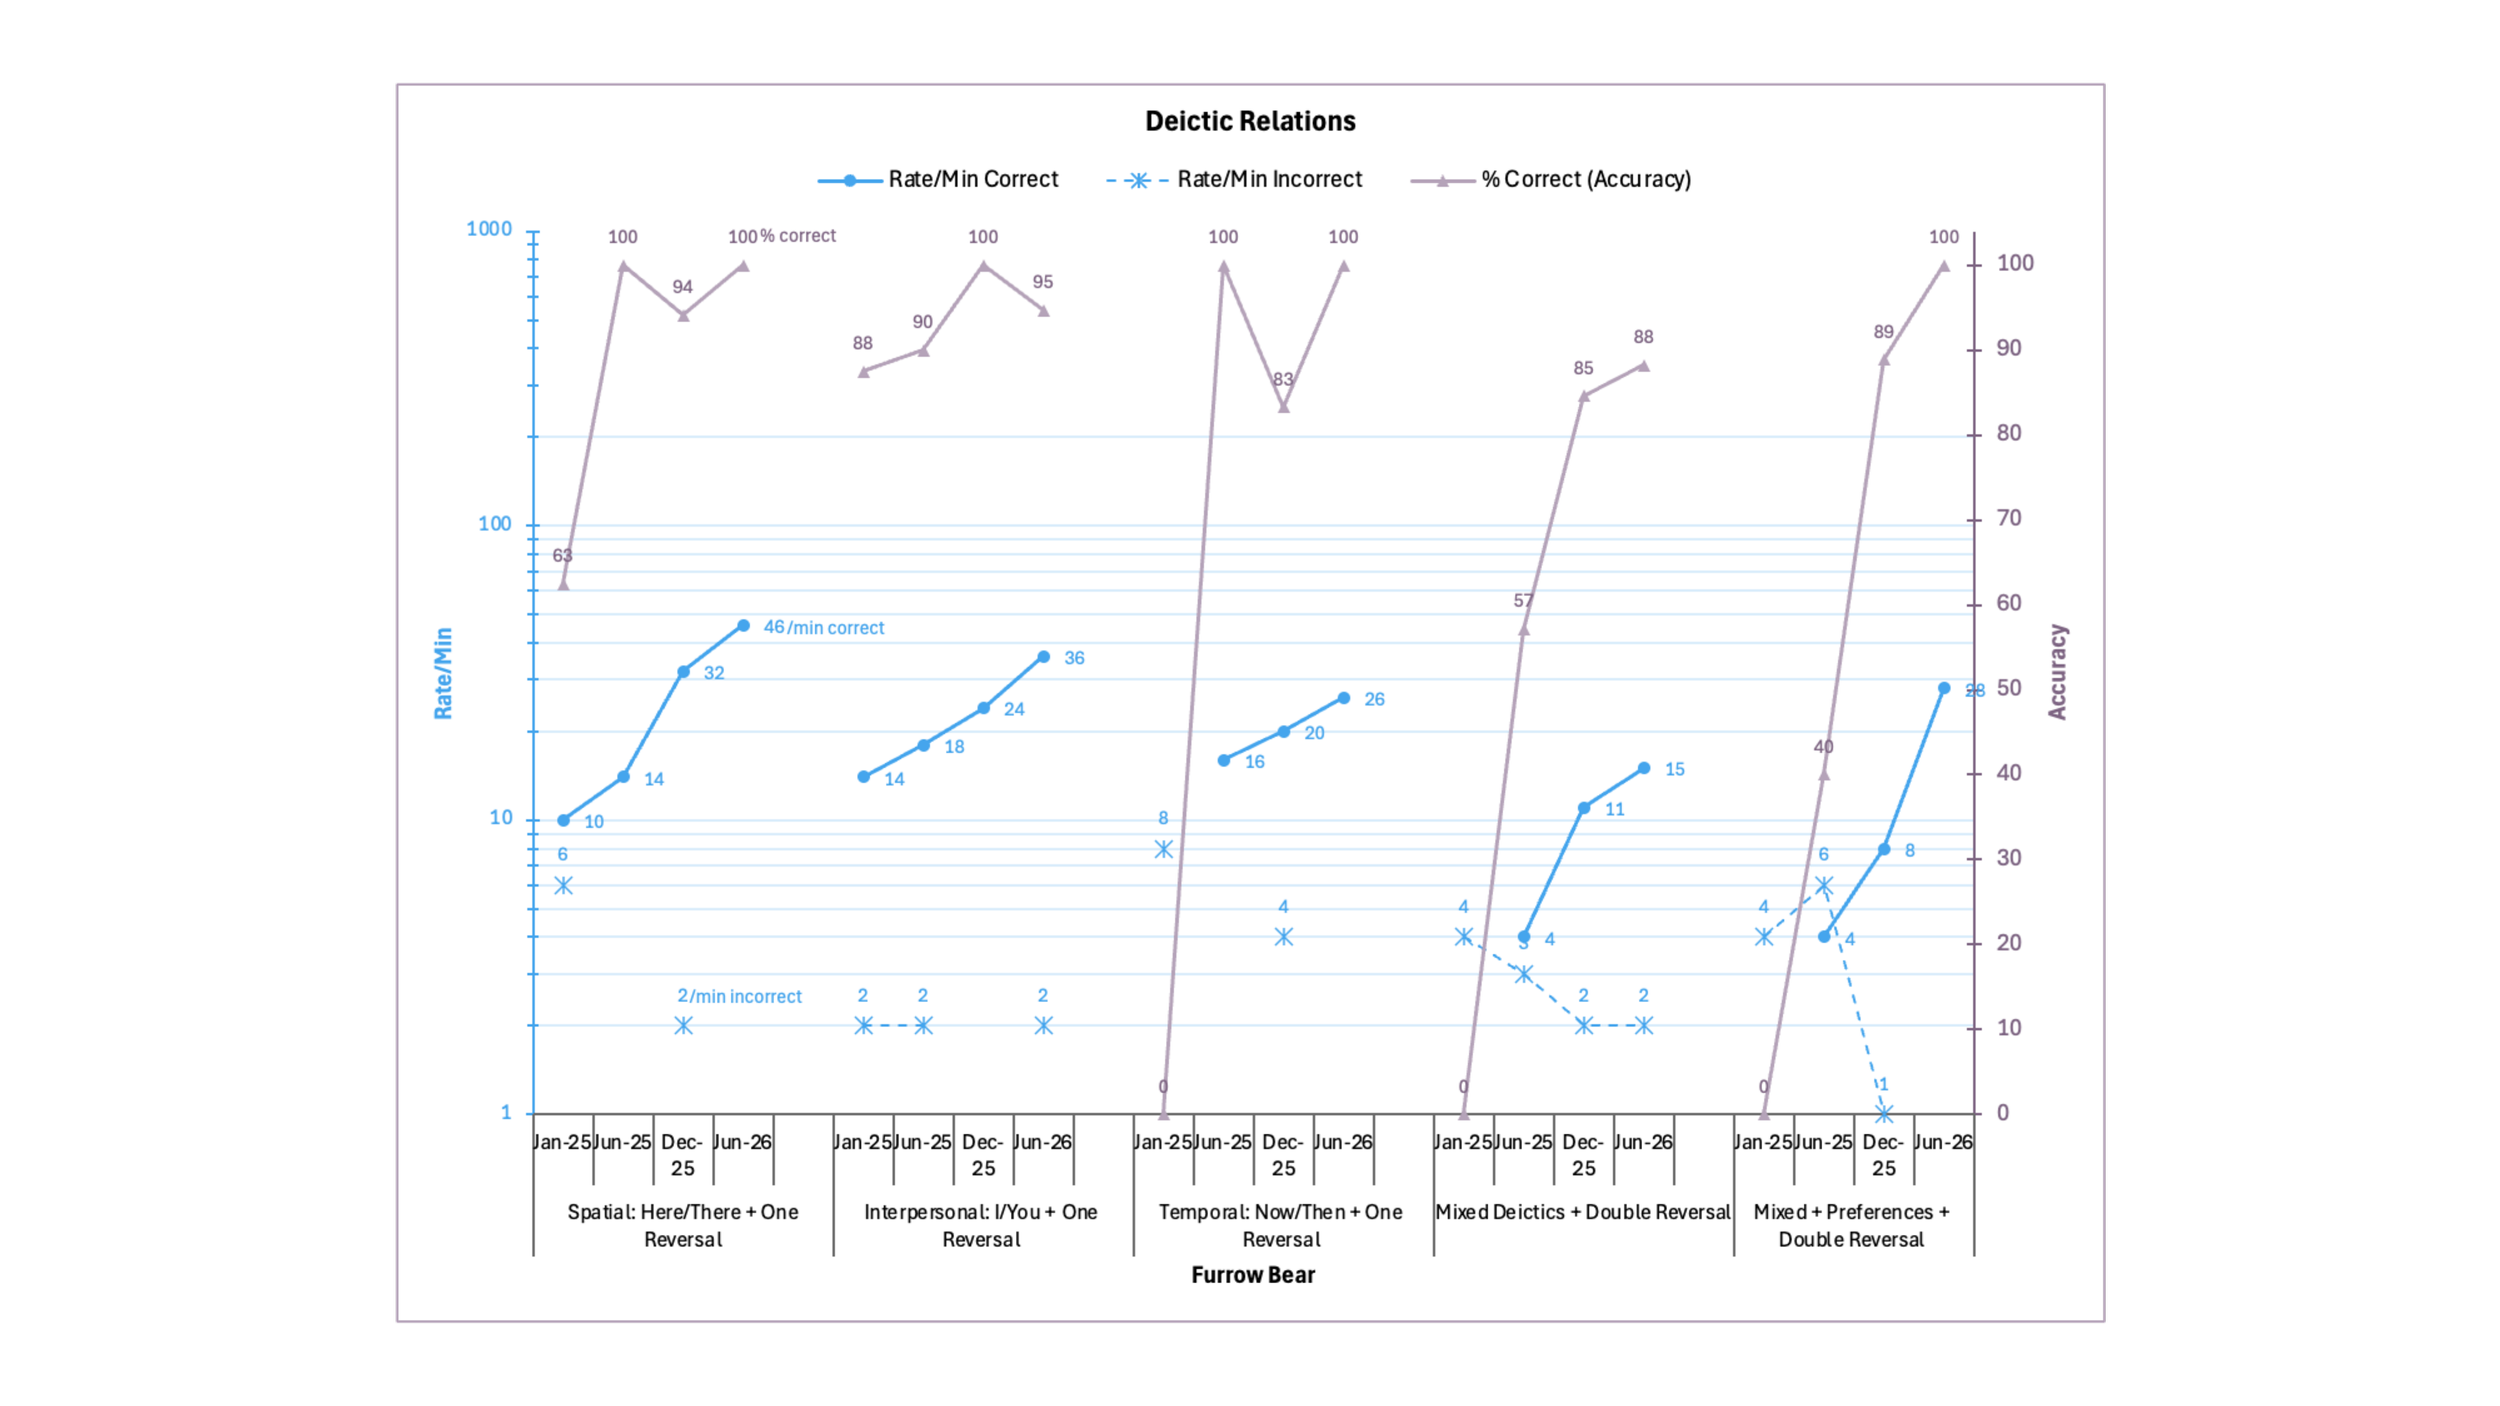
Deictic Relations
Spatial: Here/There + One Reversal
Interpersonal: I/You + One Reversal
Temporal: Now/Then + One Reversal
Mixed Deictics + Double Reversal
Mixed + Preferences + Double Reversal
Analogy (Relating Relations)
Nonarbitrary Analogy
Arbitrary DT & ME
Arbitrary CE
Verbal Analogies A : B :: C : D
The RLA course will train providers to:
Administer the RLA: RLA practice and feedback opportunities during training sessions
Input RLA data and create assessment tables and graphs
Select target training programs based on assessment data
Create a final assessment report with data tables, graphs, and recommendations
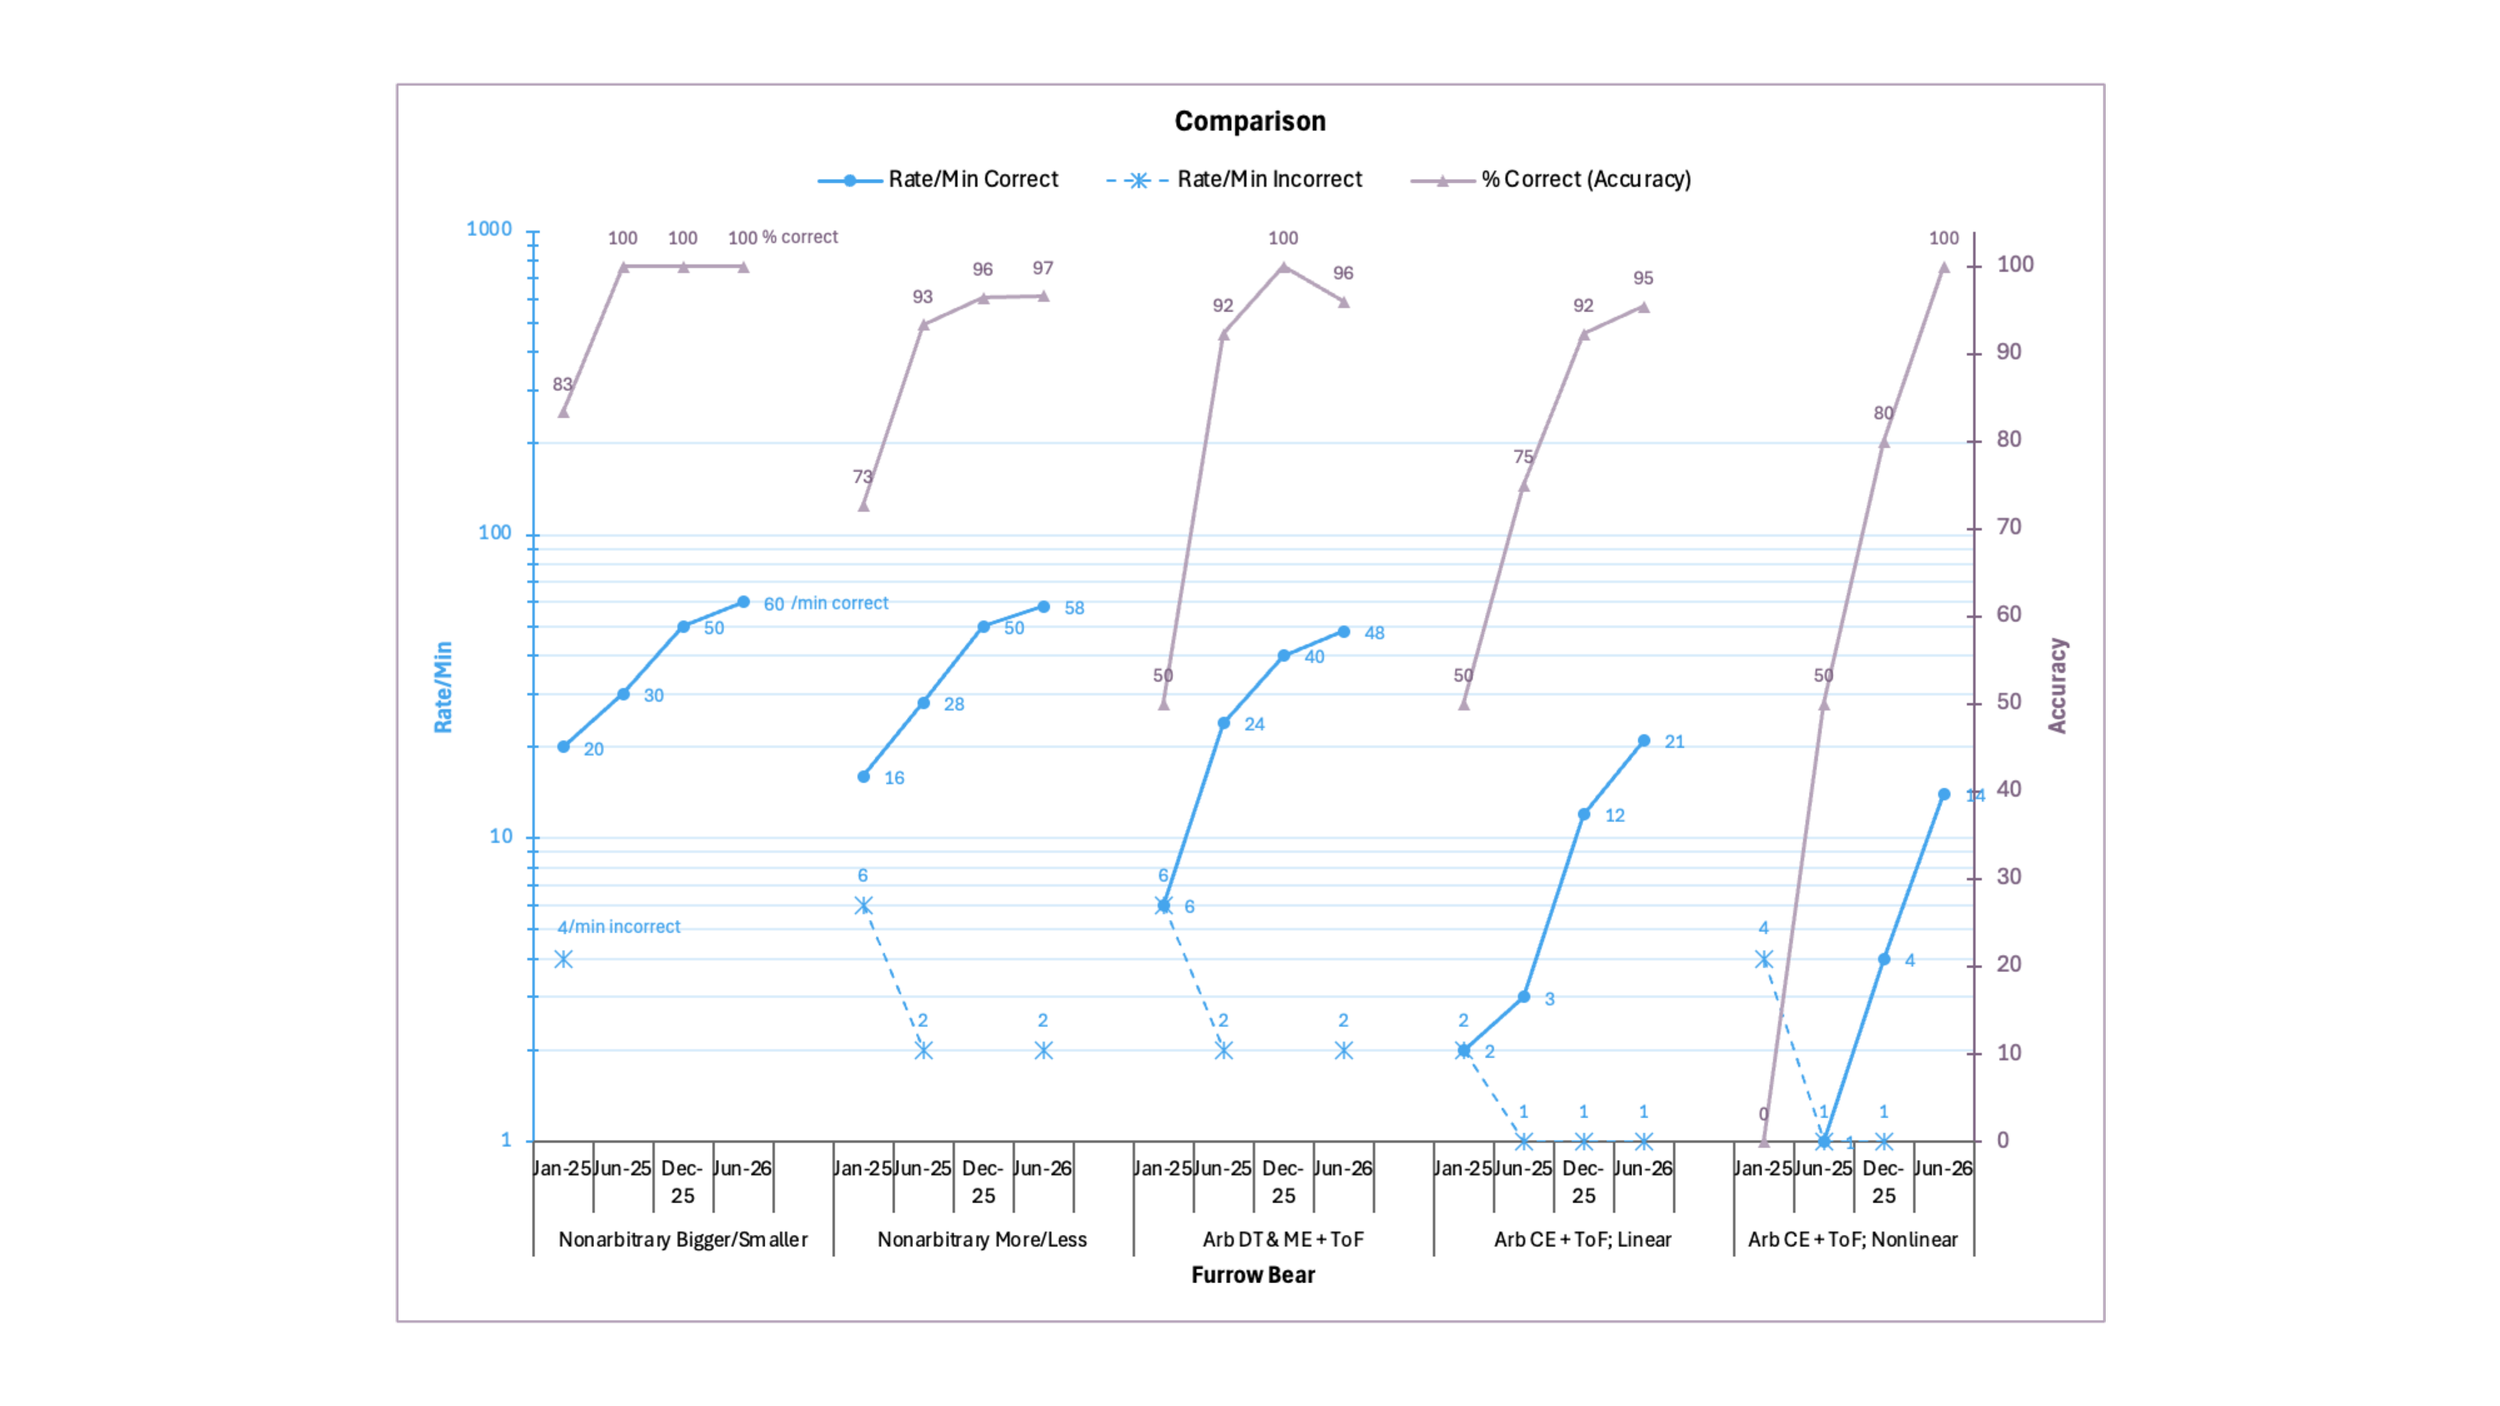
The left axis shows rate per minute on a logarithmic scale, which displays values based on multiplicative change rather than equal numerical differences, and the right axis shows percent correct. Because logarithmic scales are defined only for positive values, a value of 0, such as 0 correct responses, cannot be displayed on the graph.